Project P-05 · Dublin City University coursework
Power BI sales analysis
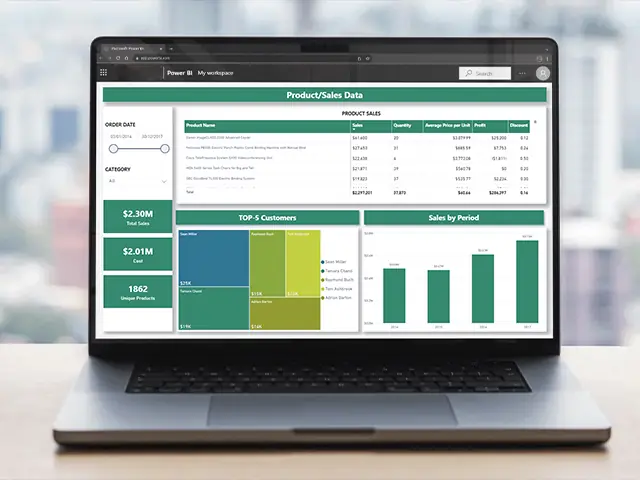
A business analytics dashboard for Blackbird, a company seeking insight from its sales data, so it can analyse its sales performance and make data-driven decisions for growth.
- Credit
- MT412 group project
- Stack
- Power BI
01 What it is
The dashboard breaks down individual orders: customer information, location, order amounts, sales, product quantities and profit margins. Blackbird can track sales trends, identify top-selling products and monitor profitability across regions and timeframes.
02 Method
- Geographic reach. A coloured sales-volume map of the United States shows the strongest and weakest states; a filled map shows the most popular product sub-category in each state.
- Operations. Q&A for quick data exploration, cards for top-selling products by category, charts of the most common shipping methods, and an analysis of how average discount rates affect sales.
- Customers. Customer data (ID, name, location) supports segmentation, so marketing and sales strategies can be tailored.
03 Results
An interactive dashboard that gives Blackbird a comprehensive view of its sales data, supporting data-driven decisions, strategic planning and improvements to logistics, pricing and promotions.
04 Tools
05 Credits
MT412 group project (Group 3), Dublin City University: Bohdan Boiprav, Catalin Bondari, Cian Shannon, James Howard and Maxime Junca.
Next project
Bank customer churn prediction